Server Metrics
Metrics gives you a live view of server resource usage and performance. Use it to understand CPU, memory, disk, network activity, uptime, and how those values change during the current session.
Metrics overview
The page is designed for monitoring rather than changing server settings. It collects live resource information and displays both current values and historical charts.
Metrics tells you what the server is consuming. Console tells you what the application is doing. Together they are much more useful when diagnosing a problem.
Live mode and time range
At the top of the page, Volyx shows whether the metrics view is currently live and lets you select a time range for the charts.
Current resource summary
The summary cards show the latest value for the most important server resources.

Shows current processor usage generated by the server process.
Shows the current amount of RAM being consumed compared with the server memory limit.
Shows the amount of server storage currently in use compared with the available disk limit.
Shows the current rate of data being received by the server.
Shows the current rate of data being sent by the server.
Shows how long the current server session has been running.
One CPU or memory reading does not describe the entire session. Use the charts below to see whether a value is temporary or sustained.
Resource Performance
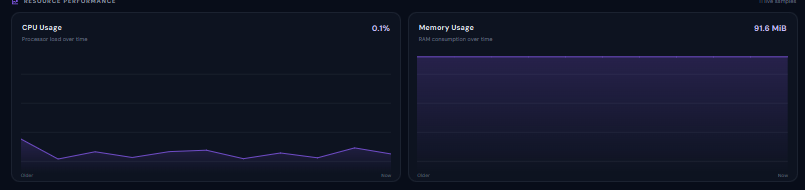
Resource Performance shows how CPU and memory usage change over time.
CPU Usage
The CPU chart shows processor load over the selected period. It is useful for identifying short spikes, repeated workload patterns, or sustained high CPU usage.
Memory Usage
The Memory chart shows RAM consumption over time. A stable application may stay around a consistent level, while a steadily rising graph can be worth investigating.
Builds, dependency installation, startup, garbage collection, and heavy application work can temporarily increase CPU or memory. Focus on sustained or unexpected usage.
Understanding CPU usage
CPU measures how much processing capacity the server process is using. Low usage normally means the application is mostly idle, while higher usage can appear during active workloads.
Investigate CPU when:
- Usage remains high for a long period.
- The application becomes slow while CPU is elevated.
- CPU suddenly increases after a deployment or update.
- The server repeatedly crashes during heavy processing.
Understanding memory usage
Memory shows how much RAM the application currently consumes.
Watch the memory graph when:
- Usage continues increasing without returning to a normal level.
- The process exits because of insufficient memory.
- Performance becomes worse as memory usage approaches the limit.
- A new feature or dependency noticeably changes RAM consumption.
Metrics can show that memory reached a high level, but Console and Last Start Info usually provide the actual error or exit reason.
Network Traffic
Network Traffic displays data received and sent by the server over time.
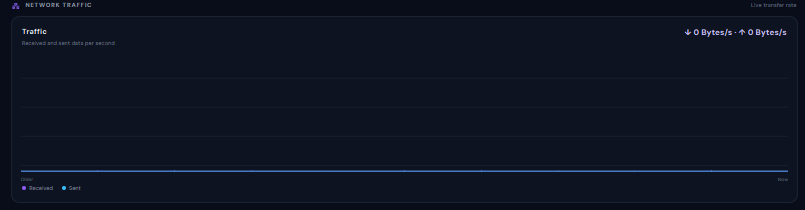
Traffic entering the server from external services, clients, APIs, or other network sources.
Traffic leaving the server toward clients, APIs, Discord, databases, websites, or other services.
A server can show very little traffic when it is idle. Higher network activity is expected when an application is actively serving requests or communicating with external services.
Disk usage
Disk shows how much server storage is currently occupied.
Storage can be consumed by:
- Project source files.
- Dependencies and package caches.
- Application-generated data.
- Logs.
- Build output.
- Uploaded files.
If disk usage becomes unexpectedly high, inspect Files and identify which directories are consuming the available space.
Session Summary
Session Summary provides aggregate values calculated from the samples collected during the current metrics session.

The highest CPU reading recorded during the current session.
The average CPU usage across the collected samples.
The highest memory reading recorded during the session.
The average memory usage across the collected samples.
The number of measurements used to produce the displayed session statistics.
Using Metrics for troubleshooting
Check whether the problem involves CPU, memory, storage, or network activity.
Use a wider range when you need to know whether the problem was only a short spike.
Use the summary cards together with the charts.
Correlate the resource spike with application logs or errors.
If the server crashed, Config can show the previous exit code and crash information.
Next step
Continue with Smart Terminal to learn how to run shell commands, install dependencies, inspect files, and work with your project from a terminal interface.