


Choosing a Database for a Discord Bot: SQLite, PostgreSQL, or Redis
Select storage based on data durability, concurrent writes, and operational limits.
Read article ↗A measured approach to Minecraft lag using spark profiling, tick timing, chunk generation, plugin investigation, and repeatable tests.
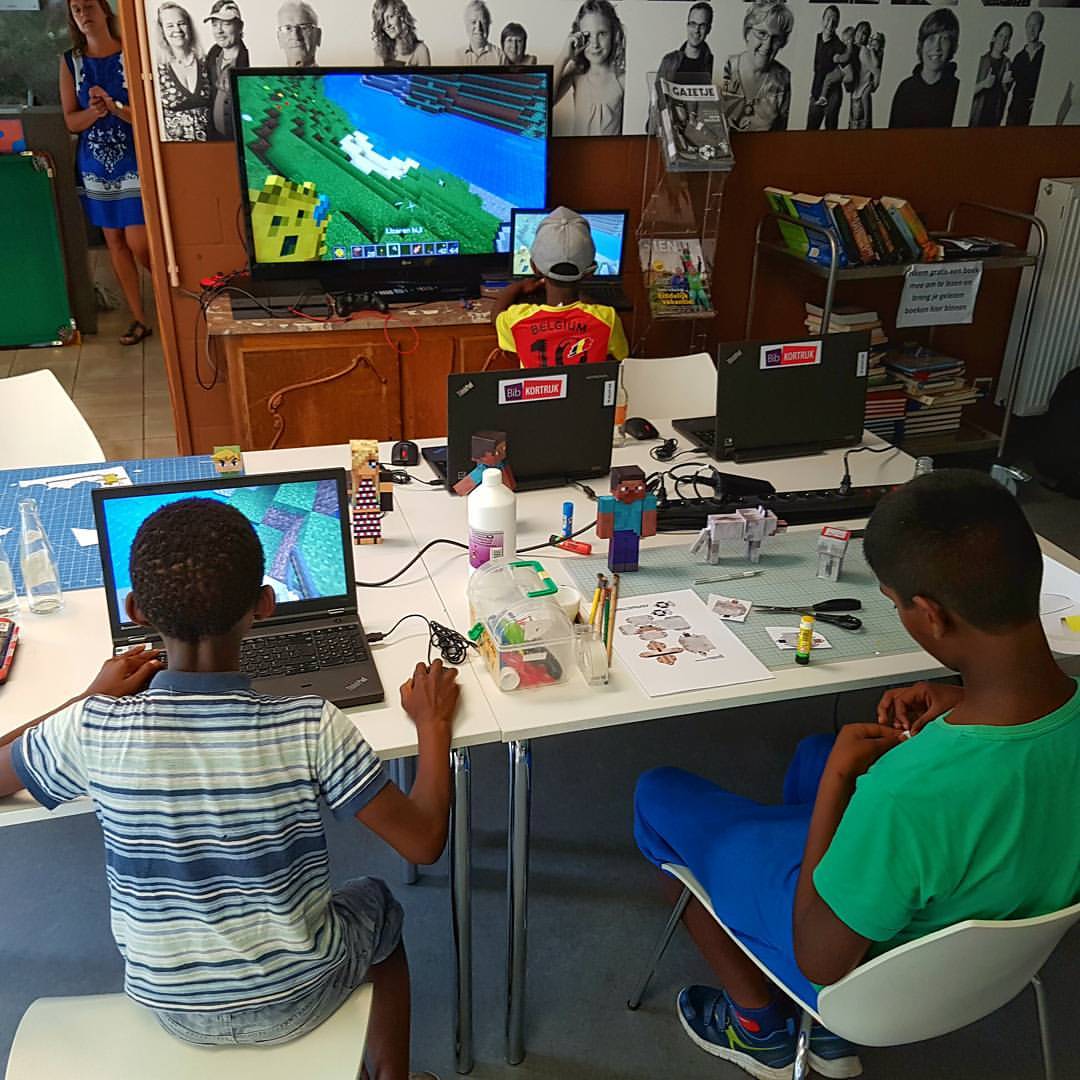
Image credit: bruno — CC0. Source media; not a benchmark or screenshot of a Volyx test.

Image credit: Xbox México — CC BY 3.0. Illustration only; not a performance benchmark.
When a Minecraft server feels slow, the first step is to distinguish network delay from server tick lag. These problems can feel similar to players, but they have very different causes. A high ping may make interactions appear delayed even while the game server maintains a healthy tick rate. By contrast, expensive plugins, mobs, block entities, and world generation can overload the main server thread and reduce TPS.
This guide uses measurements rather than generic advice to “allocate more RAM” or “install lag-fix plugins.” It explains how to collect a spark report, read basic timing concepts, isolate workloads, and verify changes without destroying the characteristics that make your server enjoyable.
Ask when the issue began, whether all players are affected, whether it occurs only in particular worlds or chunks, and whether it appears during exploration, farming, or combat. Record the Minecraft version, server implementation, installed plugins, and hosting plan. Small details matter: a slowdown just after a plugin update suggests a different investigation from lag that occurs only when players generate new terrain.
Network latency is usually described in milliseconds of round-trip delay. It depends on geographical distance, routes, packet loss, and the user’s network. High ping can coexist with healthy server processing. Server tick lag instead describes the server struggling to process the game simulation on time. Both problems require evidence, but only tick lag is directly diagnosed with CPU-time profiling.
As a quick check, compare reports from multiple players on different networks. If one distant player has high ping while others play normally and profiling shows stable tick processing, a CPU upgrade is unlikely to solve that player’s problem. If everyone sees mobs freeze when a farm turns on, investigate tick-time work.
Minecraft’s target is normally 20 ticks per second. Each tick has approximately 50 ms available. MSPT describes how much time a tick takes. A persistent value above 50 ms indicates that the main tick cannot consistently meet the 20 TPS target.
A useful mental model is that TPS describes whether the simulation is keeping up, while MSPT helps explain the processing cost behind it. Do not read one instant of MSPT as representative of an entire hour; short spikes may be caused by scheduled backups or occasional chunk generation. Capture the problem under its usual conditions.
Paper’s documentation describes /tps and /mspt, but recommends modern spark profiling for performance investigations. Timings is no longer the preferred route on current Paper releases.
Starting with Minecraft 1.21, Paper bundles spark. For supported servers, start a five-minute profile while the lag is occurring:
/spark profiler start --timeout 300At completion, the command provides a report URL. Open it and inspect the most expensive tasks, their relative time cost, and whether the expensive work comes from a plugin, entity behavior, chunk system, or another part of the server. The specific report interface can evolve, so follow the current spark documentation for the version you use.
For unusually long tick spikes, Paper documents an option that focuses on ticks over a specified threshold:
/spark profiler start --only-ticks-over 100 --timeout 300That is useful when the average looks acceptable but players experience periodic freezes. Do not publish sensitive report details without checking what server information the report contains. A profiler is a diagnostic instrument, not a magic optimization command.
Record concurrent player counts, whether chunk generation was happening, and which farms or minigames were active during capture. Without this context, it is easy to blame an innocent function that happens to be busy during a legitimate workload. Re-run a test in similar circumstances after every change.
A plugin can schedule repeated work, perform expensive scans, write files synchronously, or call slow APIs on the main thread. A profiling report may help identify where CPU time is being spent. Check whether the problematic plugin version is compatible with the Minecraft server release, read its documentation, and test the suspected task in a copy of the environment.
Do not remove every plugin at once on a production server. Instead, reproduce the issue in a safe test environment using a controlled set. Keep notes: plugin name, build version, triggering action, observed tick time, and result after changes.
Dense animal farms, excessive villagers, hoppers, and redstone contraptions can increase the number of operations performed every tick. This does not mean all farms should be banned. The correct response depends on which activity the profiler shows as expensive. Test whether limiting a particular farm or moving a task changes the measured load.
Exploring terrain that the server has never generated can introduce noticeable spikes. If the issue appears whenever players travel rapidly into new areas, consider scheduling world pregeneration during a quiet maintenance window using a compatible tool. Make a world backup first and leave enough disk space; pregeneration can use substantial CPU, storage, and memory.
Insufficient heap can trigger frequent garbage collection, but simply assigning all available host RAM to Java can starve the operating system and other services. Distinguish between real heap pressure and non-heap/native memory, plugins retaining objects, or CPU saturation. A profiler and JVM metrics provide more information than the memory number displayed in a hosting dashboard.
Make a short record before each experiment:
| Item | Before | After |
|---|---|---|
| Minecraft and server build | Write exact version | Keep identical |
| Concurrent players | Record active count | Match closely |
| World and plugin set | Snapshot | Use same snapshot |
| Tick processing | Capture spark profile | Capture comparable profile |
| Changed setting | None | Record exact change |
This is a testing framework, not a fabricated benchmark. Do not fill in performance gains unless you actually measured them. Reversible changes are better than permanent interventions while the root cause is unknown.
First, do not treat “more RAM” as the answer to every lag report: tick processing is often limited by CPU work. Second, do not install several optimization plugins simultaneously and claim success without checking which change helped. Third, do not edit large sets of configuration values copied from another server. Settings that help a lobby may harm farms on a technical survival world.
If the symptoms disappear before a profile can be captured, continue recording when they occur. A one-time idle report can be misleading. For periodic spikes, schedule a short capture around a predictable event or use the appropriate spark threshold options.
A successful investigation ends with a clear explanation: what caused the problem, what evidence pointed to it, what changed, what was measured after the change, and what compromises were accepted. Even if you ultimately choose better hosting hardware, that decision should be based on the workload’s needs rather than an untested guess.
Editorial note: Do not mistake an illustrative Minecraft picture for a real spark report. Capture an actual report from your own server when documenting measured results.
Explore more in-depth articles with code, visuals, and practical walkthroughs.
Browse all articles ↗
Select storage based on data durability, concurrent writes, and operational limits.
Read article ↗
Read specific failures rather than repeatedly resetting your bot.
Read article ↗
Verify signatures, protect endpoints, and handle interaction timing correctly.
Read article ↗